Levels of Data Analytics
Introduction
As with most technical terms, some ambiguity and incorrect usage can be expected. The words ‘analysis’ and ‘analytics’ are no exception. In many articles and news stories terms such as ‘analytics’, ‘descriptive’ and ‘predictive’ are used but how do these terms relate to one another and, more importantly, where do they differ? It should be mentioned that a multitude of types of analytics could be identified, though the four mentioned in this article can be considered as the four most general and all-encompassing types.
Gartner Analytic Ascendancy Model
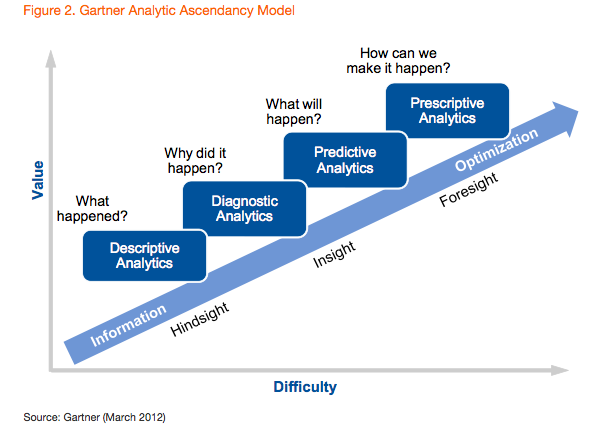
The Gartner Analytic Ascendancy model is shown below to help illustrate the relationship between these types of analytics. In the model we can identify four different types of analytics and rank these in terms of value and difficulty. Do note however that a linear relationship between value and difficulty is a simplification of reality.
Figure 1: Gartner Analytic Ascendancy Model (Gartner, March 2012)
In the next four sections, each individual ‘step’ of analytics will be explored a little further and some examples are given.
Descriptive Analytics
Descriptive analytics could be described as the simplest form of analytics discussed in this article. However, its importance must not be understated. As descriptive analytics is the first step in a complex process, it provides a solid foundation for further analytics.
The objective of descriptive analytics is answering the question of what happened. For example, a retailer could gain insight into their average daily/ weekly/ monthly sales volume, or a manufacturer in the average downtime of their machinery. What descriptive analytics cannot do is explain why this happened, only what happened. What is interesting about descriptive analytics is the fact that powerful insights can be gained with some simple arithmetic operations such as mean, median, mode, or minimum and maximum values.
Some useful tools for descriptive analytics are Microsoft Excel, SPSS, and STATA.
Diagnostic Analytics
An answer to the question of why something happened can be gained by moving up one step on the ladder from descriptive analytics towards diagnostic analytics. Diagnostic analytics takes a deeper look at the data by measuring historical data against other data and therefore takes a better look at it. Some commonly used techniques in diagnostic analytics are drill-down, correlations, probabilities, and identifying patterns.
With the availability of context, answers to questions such as ‘how effective was our promotional campaign based on customers response in different regions?’ or ‘why is sales higher/ lower than last year?’ can be found. However, diagnostic analytics offers limited actionable insights as it helps bring understanding of causal relationships by looking backwards in time.
Predictive Analytics
Graduating from looking back in time, predictive analytics could tell you what is likely to happen in the future. As mentioned earlier, descriptive analytics provides the foundation for more advanced analytics. It is at the stage of predictive analytics that the quality of the previous two types of analytics shows their importance. Without a reasonable amount of high quality data, estimates provided by the predictive analytics step are useless. Furthermore, the predictions provided are the probabilities of the occurrence of a specific event, it is therefore not guaranteed that an event will happen.
One of the most well-known examples of predictive analytics is demand forecasting. Where organisations use historic data to predict what next month’s demand is most likely going to be. When such a model is accurate enough, further decisions could be based on it. Such as a leaner raw materials order cycle or maintaining lower levels of inventory.
Some useful tools for predictive analytics are Python, MATLAB, and RapidMiner.
Prescriptive Analytics
The final step of the ladder is prescriptive analytics, which answers the question of which action to take to gain a future advantage or mitigate a threat. Prescriptive analytics builds upon the results of predictive analytics but it does not simply predict what is likely to happen. Prescriptive analytics suggests all favourable outcomes and suggests which courses of action needs to be taken to reach a particular outcome. Unlike the previous three types of analytics, prescriptive analytics makes use of a feedback system to learn and improve the relationship between prescribed actions and their outcomes.
A well-known example of prescriptive analytics are the recommendation systems used by Netflix or Spotify. A user will submit data or give a rating to recommend an item to another user who has a similar taste but does not have the item in its current list. It is also possible to use discrete characteristics of an item to recommend additional items with similar properties.
Bringing it all together
Having explored four types of analytics a little further, we are now able to better understand the Gartner Analytic Ascendancy model shown above. The model presents these types of analytics as a sort of linear growth from one ‘step’ to the next. Though this is a simplification of reality, the reasoning behind it is sound. If one wishes to employ predictive or even prescriptive analytics, one must first start at the descriptive analytics level and move up from there. Where a more involved type of analytics offers greater insight than its predecessor does whilst requiring more engagement of the users.
References
Gartner. (2018). Analytics. Retrieved from Gartner: https://www.gartner.com/it-glossary/analytics/
Kohavi, R., Rothleder, N. J., & Simoudis, E. (2002). Emerging trends in business analytics. Communications of the ACM, 45(8), 45-48.
Oxford Dictionaries. (2018). Analysis. Retrieved from Oxford Dictionaries: https://en.oxforddictionaries.com/definition/analysis
Oxford Dictionaries. (2018). Analytics. Retrieved from Oxford Dictionaries: https://en.oxforddictionaries.com/definition/analytics


